I recently cloned my Windows 10 installation from a SSD to a M.2 PCIe SSD. Although everything is functioning properly, it takes around 85 to 115 seconds for the system to boot. I’m not sure if this is a result of the migration or if it was always like this, as I usually use Wake-on-Lan to start my PC and don’t pay attention to the boot time. I’ve spent most of the day trying to use Windows Performance Analyzer logs to troubleshoot the slow boot time, but I’m having difficulty understanding the information.
I’ve found similar issues discussed on a web community and was hoping someone with more experience might be able to look at my specific issue and/or explain to me how I can track down the cause myself. Here is a link to my WPA logs in .etl format. [The link was omitted by admin.]
3 Answers
Introduction
Windows 10 is known for its fast boot times compared to its predecessors. However, sometimes users can experience slow boot times, which can be frustrating, especially if you have a lot of work to do. In this blog post, we will be discussing how to troubleshoot slow boot times using Windows Performance Analyzer logs. We will also be looking at a specific case where a user migrated their Windows 10 installation and experienced slow boot times.
What is Windows Performance Analyzer?
Windows Performance Analyzer (WPA) is a tool that is used to analyze system performance. It is part of the Windows Performance Toolkit, which is a collection of tools used for performance analysis. WPA is used to analyze performance traces that are collected by Windows Performance Recorder (WPR) or Xperf. WPA provides detailed information about system performance, including CPU usage, disk I/O, and memory usage.
Collecting a Boot Trace
The first step in troubleshooting slow boot times is to collect a boot trace. A boot trace is a performance trace that is collected during the boot process. To collect a boot trace, you will need to use Windows Performance Recorder (WPR), which is part of the Windows Performance Toolkit.
To collect a boot trace, follow these steps:
1. Open Command Prompt as an administrator.
2. Type the following command: wpr -start GeneralProfile -start DiskIO -start FileIO -start Registry -start NetworkTrace -filemode
3. Press Enter.
4. Wait for the system to boot.
5. Open Command Prompt as an administrator.
6. Type the following command: wpr -stop C:BootTrace.etl
7. Press Enter.
The boot trace will be saved to the C:BootTrace.etl file.
Analyzing the Boot Trace
Once you have collected the boot trace, you can use Windows Performance Analyzer (WPA) to analyze it. To analyze the boot trace, follow these steps:
1. Open Windows Performance Analyzer.
2. Click File > Open.
3. Navigate to the C:BootTrace.etl file and click Open.
4. Wait for the trace to load.
5. Click on the CPU Usage (Precise) graph.
6. Look for any spikes in CPU usage during the boot process.
7. Click on the Disk I/O graph.
8. Look for any spikes in disk I/O during the boot process.
9. Click on the Network I/O graph.
10. Look for any spikes in network I/O during the boot process.
11. Click on the Memory Usage graph.
12. Look for any spikes in memory usage during the boot process.
If you notice any spikes in CPU usage, disk I/O, network I/O, or memory usage, you may have found the cause of the slow boot time. You can then investigate further to determine the root cause.
Case Study: Slow Boot Times After Migration
In the case of the user who migrated their Windows 10 installation, they experienced slow boot times after the migration. To troubleshoot this issue, they collected a boot trace using Windows Performance Recorder (WPR) and analyzed it using Windows Performance Analyzer (WPA).
After analyzing the boot trace, they noticed that there were no spikes in CPU usage, disk I/O, network I/O, or memory usage during the boot process. This led them to believe that the slow boot time was not caused by a system performance issue.
Upon further investigation, they discovered that the slow boot time was caused by a driver issue. Specifically, they had a driver installed for a device that was no longer present in the system. This driver was causing the system to hang during the boot process, which was causing the slow boot time.
Once they removed the driver, the system booted up quickly, and the slow boot time issue was resolved.
Conclusion
In conclusion, slow boot times can be frustrating, but they can be resolved by using Windows Performance Analyzer logs to troubleshoot the issue. By collecting a boot trace and analyzing it using Windows Performance Analyzer, you can identify the root cause of the slow boot time and resolve the issue. In the case of the user who migrated their Windows 10 installation, they were able to identify a driver issue as the cause of the slow boot time and resolve the issue by removing the driver.
I’m sorry to hear about your slow boot time. It sounds like you’ve been trying to use Windows Performance Analyzer (WPA) to troubleshoot the issue, but are having difficulty understanding the logs. To help you better understand the information in the logs, it would be helpful to know more about your specific issue.
Could you provide more details about your system and the steps you’ve taken so far to try to resolve the slow boot time?
Based on your boot trace, it appears that the delay you’re experiencing during boot is caused by the hibernation file (hiberfil.sys).
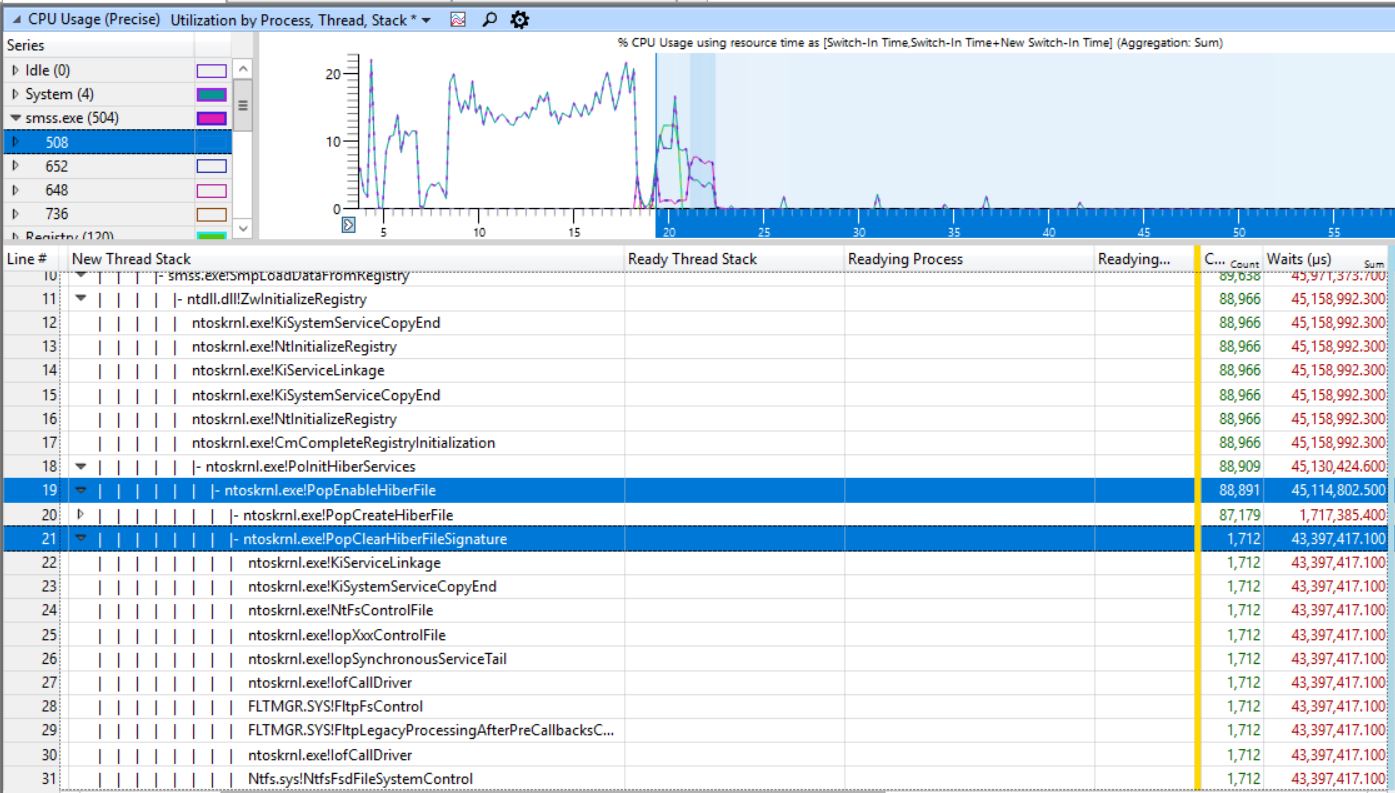
In the CPU precise graph, you can see that the SMSS process takes 45 seconds to complete the PoPEnableHiberFile function.
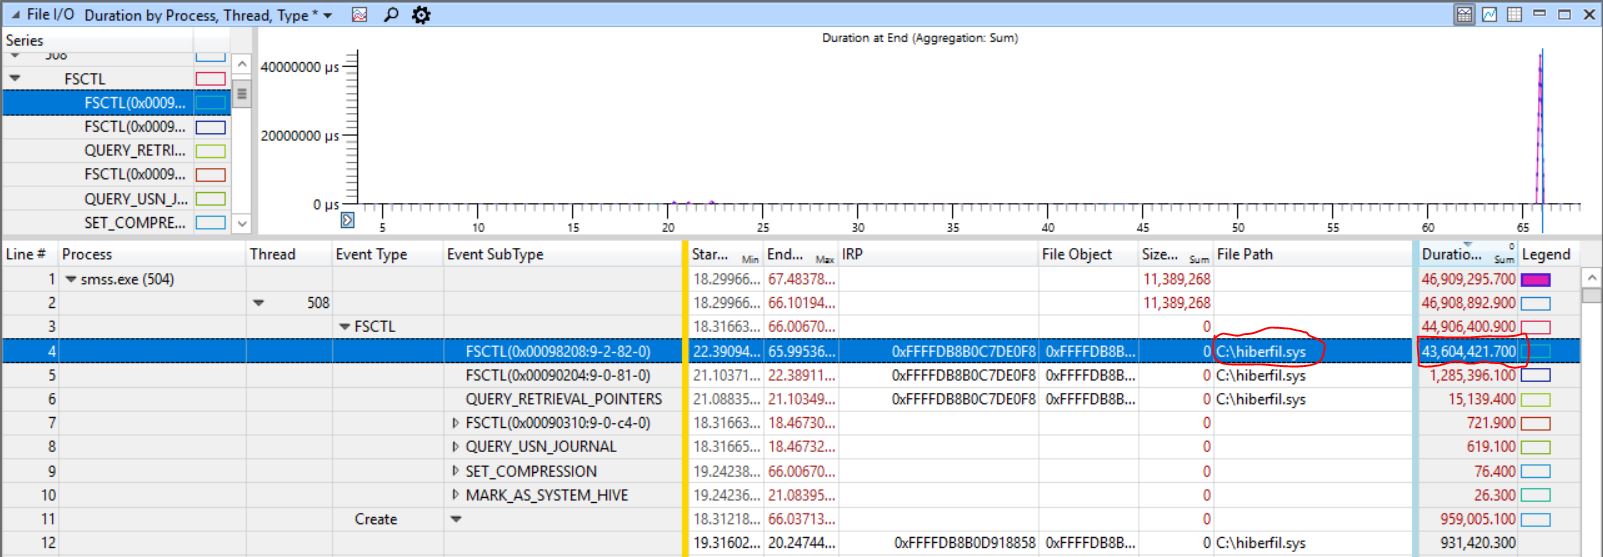
This is further confirmed by the File I/O graph, which shows the SMSS process spending 43 seconds accessing the hiberfil.sys file located at C:.
To resolve this issue, you can try disabling hibernation by running the following command: powercfg -h off. Restart your computer and see if this helps.
If you need to re-enable hibernation at a later time, you can use the command powercfg -h on.